Last Updated on May 26, 2023 by Ayushi Gangwar
As an investor, you’ve probably realised that investing well is rarely easy, and relying on hunches and gut feeling just won’t cut it. The process of manually sifting through thousands of stocks, narrowing them down to align with your Portfolio vision, and then dedicating countless hours to researching, discussing with friends, scrolling WhatsApp advice, and meticulously tracking everything on spreadsheets can be an overwhelming hassle. That’s why you must meet your friend, Ticketape – the go-to tool to access expert-backed insights that can cut your analysis time by half.
So, how can Tickertape add value to your investing journey? Let’s dive right in and walk you through the benefits it has in store for you!
Table of Contents
Evaluate any stock’s Scorecard
Now that you’re thinking about investing, you’re probably faced with the age-old question,‘Is this stock even worth investing in?’. In fact, we’ve all heard it countless times, but how can we be sure?

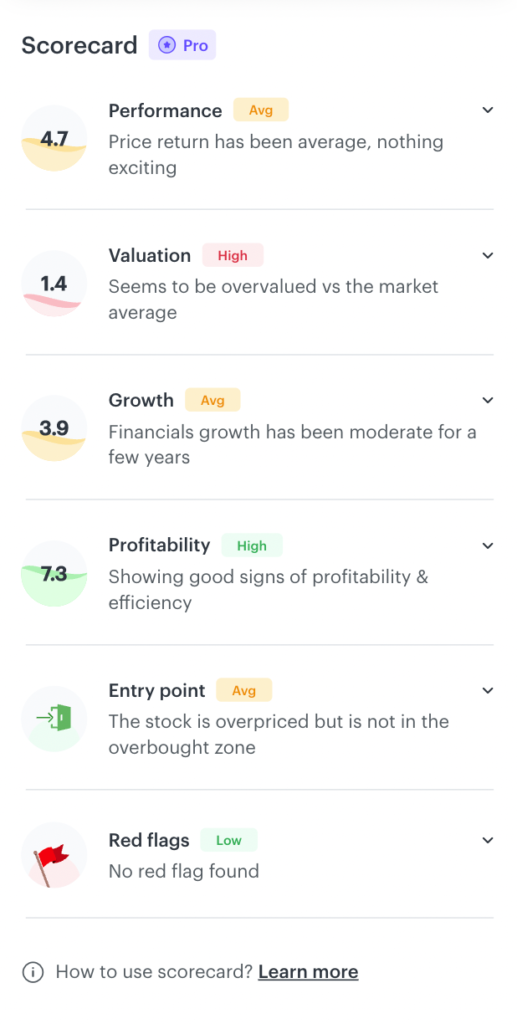
That’s where Scorecard comes in. It’s like a report card but for your stocks to help you eliminate the guesswork. The Scorecard evaluates performance, valuation, growth, profitability, entry point, and red flags. It ranks your stocks on a scale of 1 to 10 and provides comprehensive insights at every step. By understanding the fundamentals and key indicators, you can assess a stock’s potential gains and risks. Now, you’re probably wondering, ‘Okay, I’ve discovered the perfect stock, but when exactly is the right time to jump into the market?’ Well, let’s dig deeper into…
How the market is feeling with Market Mood Index
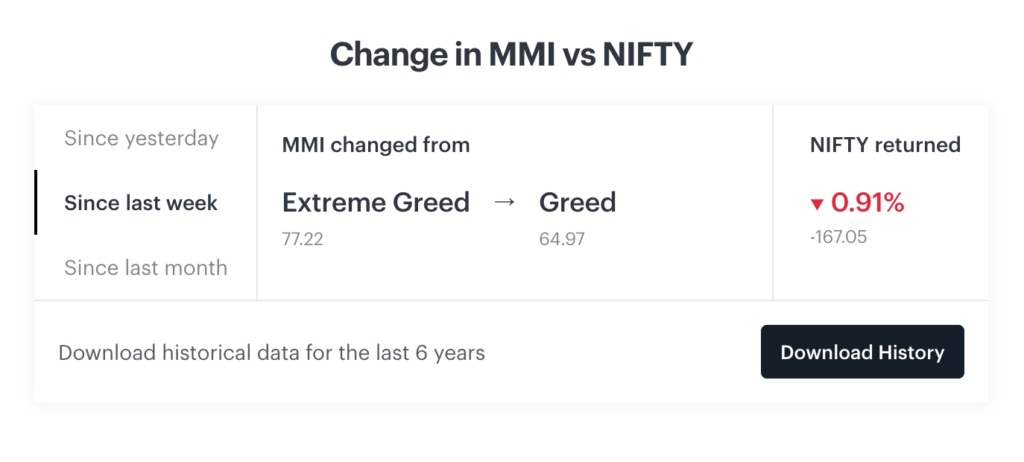
Emotions like greed and fear can sway stock prices when optimistic investors get greedy and buy, pushing prices up. Conversely, bad news triggered fear, leading to price drops and panicked selling.

News and events also significantly impact as they shape market sentiment and influence investor behaviour. Positive news boosts investor confidence and increases the MMI, while negative news creates fear and uncertainty, leading to a lower MMI. Macro events and company-specific news influence the MMI by affecting investor sentiment towards the overall market or specific stocks. The impact of news on the MMI can vary in magnitude and duration, with some causing short-term fluctuations and others having a more lasting effect depending on their significance and market conditions.

But don’t worry! Tickertape’s Market Mood Index comes to the rescue. It tracks sentiment, gauging fear and greed levels. This analysis is a reliable way to time your stock entry and exit points. But when you enter the market, sell when you exit. Your profit or loss depends on the selling minus buying prices. So, you get to make smart moves by plotting your entry and exit points strategically. But, how can you further ensure the stocks you’ve invested in are healthy? In that case, you can…
Protect your Portfolio with a Diversification Score
Maintaining a pulse on your Portfolio’s health is crucial in today’s fast-paced and unpredictable market. Each day brings new industry movements that can sway the market in either direction, and to help you gear up and stay on the right path, Diversification Score comes into play. You can evaluate your Portfolio’s risk level and benchmark it against the investor community through precise numbers, typically measuring from 1 to 100. This number is indicative of Portfolio’s diversification and risk exposure.

For example, the above image shows that the portfolio diversification score is 58, whereas the community average is 67. This indicates that there is scope to further diversify your Portfolio by adding stocks of other sectors or market cap. Here’s a detailed layout of what would different score in your portfolio indicate
| Score | Indicator | What would it mean for you? |
| 76-100 | Very Good Diversification | Your portfolio is well diversified, no need to diversify further |
| 75-51 | Good Diversification | Your portfolio can be improved by adding stocks from the other sectors |
| 50-26 | Low Diversification | Consider investing in more assets to spread your risk, diversify your portfolio by adding stocks of other sectors or market cap |
| 25-0 | Extremely Low Diversification | You have very little diversification in your portfolio; consider adding ETFs and stocks from different sectors and market caps |
Because when it comes to investing, don’t take anyone’s word for it…
Get a score on your Portfolio’s valuation
Now that you’re sorted with investing in the market, the next question is how to identify and eliminate the underperformers dragging your overall investments down? Look no further because you can judge stocks in your Portfolio based on criteria like Valuation, Momentum, Quality & Growth. These parameters are allocated a score on a scale of 0 to 100, with 100 being the highest.

The scores are further divided into “Tiers” as follows:
| Tier level | Score | What would it mean for you? |
| Tier 1 | 75-100 | Stocks in your portfolio are top-performers |
| Tier 2 | 50-75 | Stocks fall under good performers but you still got room for more |
| Tier 3 | 50-25 | It’s time to realign your investment strategy since stocks are falling into poor-performing categories |
| Tier 4 | 25-0 | Your portfolio can benefit from an upgrade since stocks are extremely poor |
The following criteria can further help:
- Valuation can help you quantify how a stock is valued in the market based on some valuation & momentum metrics, for example, PE of the stock, PE of the stock’s industry, Intrinsic value of the stock, price trend etc. A higher score represents a better-valued stock
- Momentum score quantifies the strength of the recent price trend of the stock and is based on recent historical price performance over the last 12 months and very short-term technical indicators like 14d RSI. It also incorporates some valuation metrics to weed out the highly overpriced stocks. A higher score represents a stronger price momentum
- Quality score quantifies both the quality of the management/company and the earnings/financials of the company. It considers financial metrics like profit margin, Operating cash flow growth, and other factors like Red flags like the stock being in the ASM/GSM list or the company having a high probability of default. A higher score represents a higher quality stock
- Growth score quantifies the historical growth and the growth potential of a company. It considers factors like short-term EPS growth, Company revenue vs Industry revenue growth figures, etc. A higher growth score represents a faster-growing company
Pick the right stocks with Tickertape Special Filters
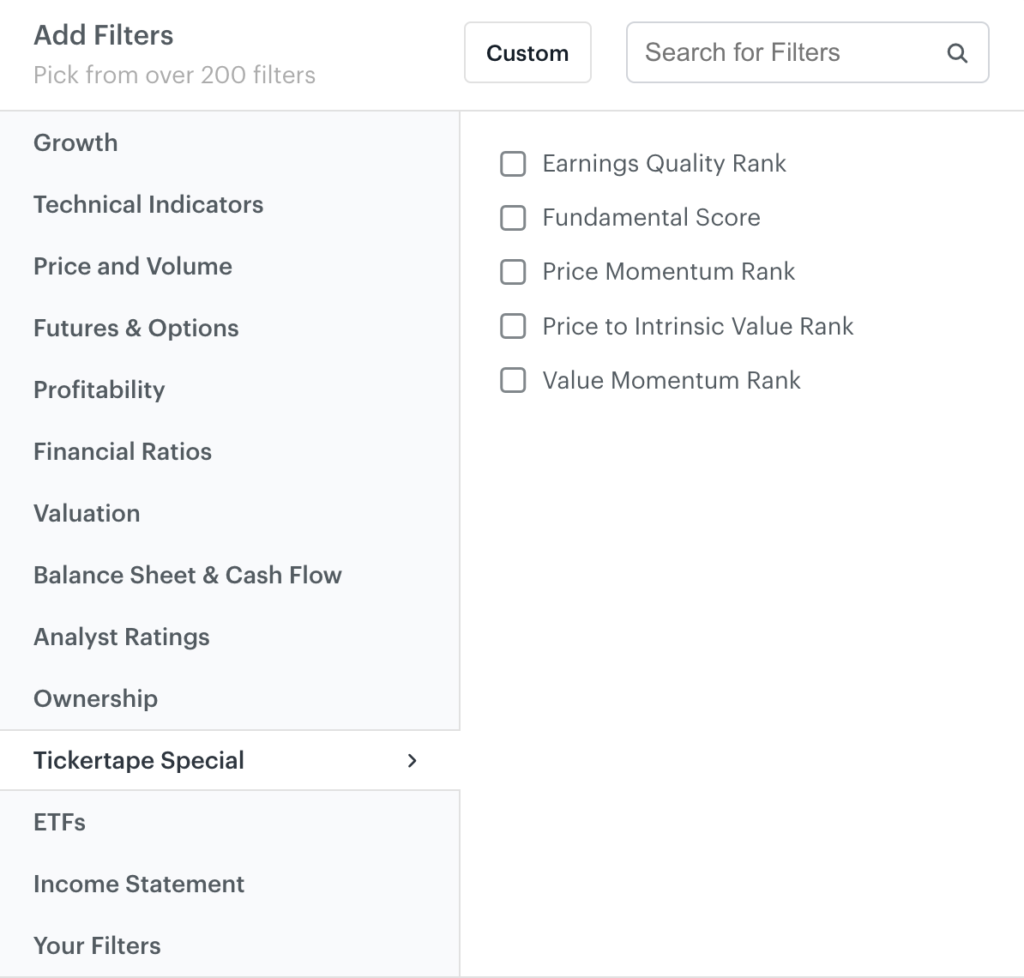
Tickertape’s special filters are designed to simplify your research process and save you valuable time. With just a few clicks, you can quickly narrow your options and focus on the stocks that matter most to you!
You can start by assessing the reliability and sustainability of a company’s earnings with the Earnings Quality Rank. This helps you identify stocks with higher-quality earnings and avoid those with potential red flags or irregularities.
- Next, evaluate a company’s financial strength, profitability, and growth potential with the Fundamental Score. This comprehensive evaluation considers various financial metrics, clearly understanding a stock’s fundamental health. To spot stocks with positive momentum, turn to the Price Momentum Rank. This filter identifies stocks consistently rising in price, indicating potential future growth
- When assessing a stock’s value, the Price to Intrinsic Value Rank is your go-to tool. This filter compares a stock’s market price to its estimated intrinsic value, helping you determine whether it is undervalued or overvalued
- Lastly, the Value Momentum Rank combines the best of both worlds by considering value and momentum factors. This filter helps you discover stocks that offer an attractive combination of valuation and positive price momentum.
With Tickertape’s special filters, you can easily streamline your stock selection process and make informed investment decisions. Say goodbye to endless research and hello to a more efficient and effective way of finding the perfect stocks for your portfolio.

These filters help investors make informed decisions by considering earnings quality, financial strength, price trends, valuation, and growth potential.
While investing isn’t easy, you can make it with Tickertape’s special features and tools that can help you cut your analysis time by half and easily navigate your investment journey. So, when are you planning to get started?
- Select Stocks With Analyst Ratings Filters - Jun 15, 2023
- ITC’s Report Card Is Here! - Jun 8, 2023
- Top 10 Most Popular Stocks on Tickertape - Jun 2, 2023
