Last Updated on Apr 26, 2023 by
For the last 2 yrs, inflation has been the overarching theme in the investor community. The world over inflation has been at a decade’s high. In India, we have also seen higher-than-normal inflation, though it’s not as severe as in other parts of the world.
Since this is a major shift from the times when cheap money was available, it becomes important for investors to understand how this would impact the equity market returns.
At Estee, we take into account the major macroeconomic factors like oil prices, interest rates, inflation etc., at the time of portfolio construction. This sits on top of fundamental and technical factors to create a truly multi-factor portfolio.
For this analysis, we have taken CPI (Consumer Price Index) as the measure of inflation.
It is an index used to track the increase in consumer goods and service prices. The eight major parts of CPI are given below in the table. For this, we have used a blended CPI of rural and urban.
| CPI category | CPI weights | |
| Rural | Urban | |
| Food and beverages | 0.54 | 0.363 |
| Clothing and footwear | 0.074 | 0.056 |
| Pan, tobacco and intoxicants | 0.0326 | 0.0136 |
| Housing (rent, taxes, cess) | 0 | 0.21 |
| Miscellaneous | 0.17 | 0.19 |
| Fuel and light | 0.079 | 0.055 |
| Education | 0.034 | 0.056 |
| Health (Medical) | 0.068 | 0.048 |
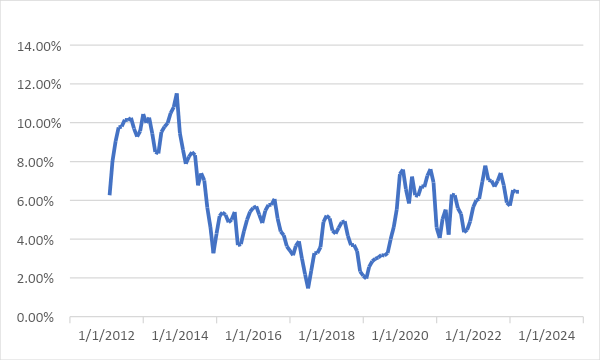
For the period of study, the average inflation has been 5.9% vs 6.4% currently.
| CPI_India | |
| Min | 1.5% |
| Max | 11.5% |
| Avg | 5.9% |
| Current | 6.4% |
Nifty vs Inflation
Also, let us see how equity markets have performed against this inflation.
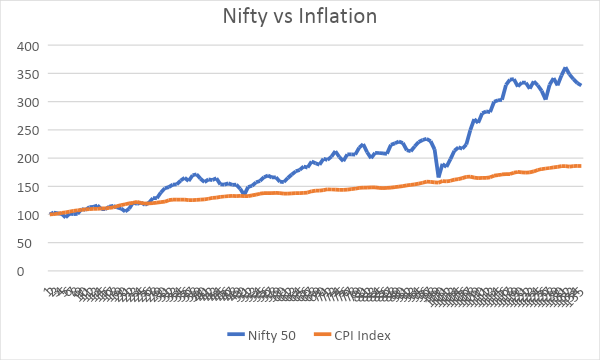
One look at the chart can tell us how equities are a very good asset class to outperform against inflation.
For the analysis, we have divided the inflation regimes into four parts. We are currently in the 50-75% range.
| CPI Percentile | CPI_YOY_India |
| <25% | < 4.3% |
| <50% | 4.3% – 5.6% |
| <75% | 5.6 % – 7.3% |
| >75% | > 7.3% |
See how inflation impacts different sectors and factors
The Ranking Table given below ranks the sectors in decreasing order of returns during a specific inflation regime. For example, the best-performing sector during the highest inflation regime is consumer staples, and the worst-performing sector is the energy sector.
| CPI Percentile Range vs. Rank | Consumer Discretionary | Industrials | Information Technology | Energy | Materials | Health Care | Financials | Consumer Staples | Communication Services | Utilities | Real Estate |
| 75-100 | 4 | 9 | 3 | 11 | 7 | 2 | 5 | 1 | 6 | 10 | 8 |
| 50-75 | 2 | 5 | 6 | 4 | 1 | 3 | 8 | 9 | 11 | 7 | 10 |
| 25-50 | 6 | 9 | 4 | 3 | 5 | 11 | 10 | 8 | 7 | 2 | 1 |
| <25 | 10 | 1 | 5 | 6 | 7 | 11 | 2 | 4 | 9 | 8 | 3 |
Returns Table (below) gives the average monthly returns in a specific inflation regime. For example, in the lowest inflation regime, Nifty 50 has given 0.4% returns, and industrials have been the best-performing sector with a 1% average monthly return during such a regime.
| CPI Percentile Range vs Average Return | Consumer Discretionary | Industrials | Information Technology | Energy | Materials | Health Care | Financials | Consumer Staples | Communication Services | Utilities | Real Estate | Nifty-50 | BSE-500 |
| 75-100 | 1.6% | 0.9% | 1.7% | 0.3% | 1.0% | 1.9% | 1.4% | 2.0% | 1.0% | 0.8% | 0.9% | 1.0% | 1.1% |
| 50-75 | 2.2% | 2.1% | 1.9% | 2.1% | 2.2% | 2.2% | 1.4% | 1.1% | 0.0% | 1.8% | 0.3% | 1.5% | 1.6% |
| 25-50 | 1.7% | 1.5% | 1.7% | 1.7% | 1.7% | 0.9% | 1.4% | 1.5% | 1.6% | 2.3% | 2.8% | 1.4% | 1.4% |
| <25 | -0.1% | 1.0% | 0.9% | 0.7% | 0.7% | -0.3% | 0.9% | 0.9% | 0.0% | 0.4% | 0.9% | 0.4% | 0.5% |
The high inflation regime has some clear winners (>50%ile). Healthcare, Consumer Discretionary, and IT are the ones which have done well, and Real Estate and utilities suffer.
Look at the impact of inflation on factors
| CPI Percentile Range vs Average Returns | Momentum | Quality | Value | LowVol | Nifty-50 | BSE-500 |
| 75-100 | 1.5% | 1.4% | 1.3% | 1.2% | 1.0% | 1.1% |
| 50-75 | 1.7% | 1.9% | 1.9% | 1.7% | 1.5% | 1.6% |
| 25-50 | 1.9% | 1.1% | 1.6% | 1.2% | 1.4% | 1.4% |
| <25 | 1.5% | 0.4% | 0.8% | 0.4% | 0.4% | 0.5% |
As we can see from the table above, momentum is the factor that works well in almost all scenarios. But in the market regime that we are currently in (inflation at 1.64%) quality and low vol have performed even better than momentum. Clearly, it would help if one is able to shift to better factors in time like these.
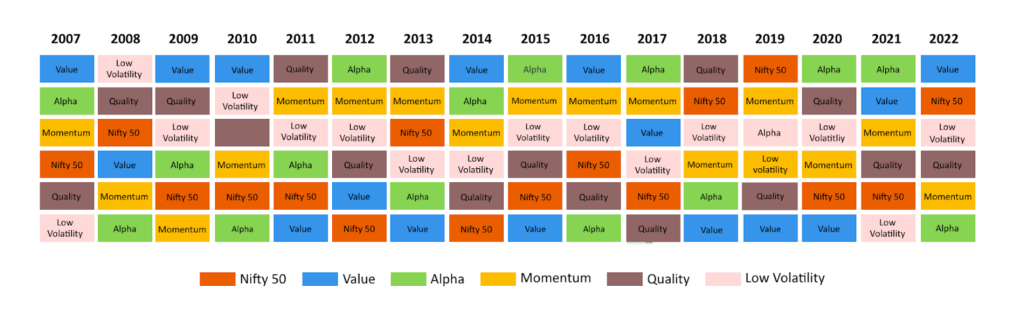
Momentum had a golden run from 2011 to 2019 and underperformed heavily in the last 3 yrs. Similarly, Value has been at the bottom for 3 straight years from 2018 to 2020 but has been a top performer over the last 2 yrs.
What we have also seen is that a strategy that is a combination of different factors has been producing better risk-adjusted returns over the long run.
Conclusion
For optimum results, one would have to consider the other macro factors like commodity prices, interest rates, USD-INR and inflation to arrive at a truly multi-factor model. Gulaq’s focus on multi-factor returns has helped us outperform the market in the last financial year, even though it was a pretty bad year for momentum portfolios.
This article is written by Vivek Sharma of Estee Advisors. Click to learn more about Estee smallcases.

- Impact of Inflation on Equity Markets Returns - Apr 26, 2023