Last Updated on May 27, 2023 by Ayushi Gangwar
Ever wondered what drives certain stocks to become the favourites of investors, captivating their attention and dominating market discussions? Today, we embark on an insightful journey into the fascinating realm of the Top 10 most searched stocks that have indisputably become the talk of the town. Join us as we delve deep into the intricate factors and compelling dynamics that make these stocks stand out amidst the vast sea of investment opportunities.
Table of Contents
ADANI ENTERPRISES LTD.
Sector: Commodities Trading
PE Ratio: 21.41
Largecap
1W Return: 1.90
1W Return vs NIFTY: 2.51
1W Return
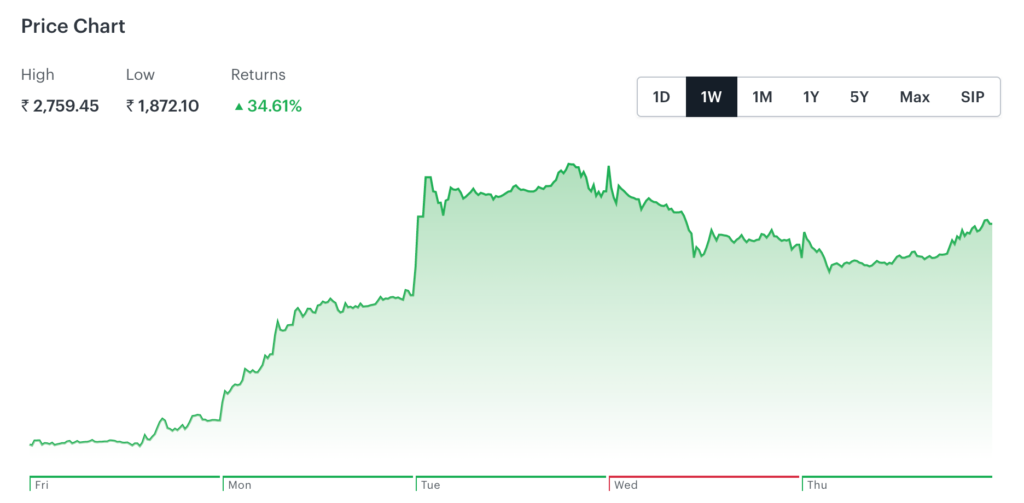
Adani Group stocks have witnessed a recent upward trend, bouncing back from a significant decline earlier this year. Adani Enterprises still lags behind, currently trading nearly 30% below its price on January 24, the day the bombshell report was published.
ITC
Sector: Consumer Staples
PE Ratio: 28.64
Largecap
1W Return vs NIFTY: 51.92
1W Return
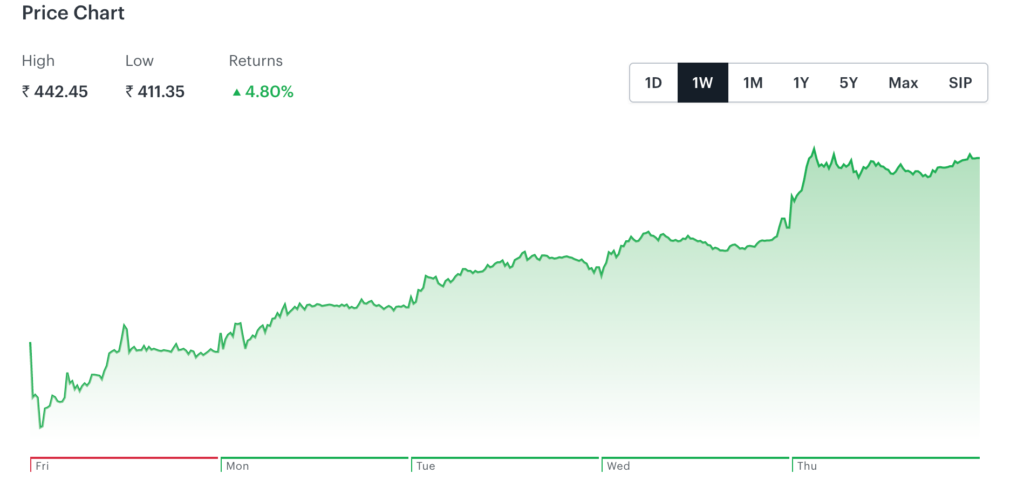
ITC‘s market cap reached Rs 5.50 trillion as its stock hit a new high of Rs 443.85, rising 1% on the BSE. With a market cap of Rs 5.51 trillion, ITC now ranks sixth overall in market cap, as per BSE data. In comparison, the S&P BSE Sensex was up 0.36% at 62,098 at 10:01 AM.
VEDANTA
Sector: Metals
PE Ratio: 10.38
Largecap
1W Return vs NIFTY: -19.32
1W Return
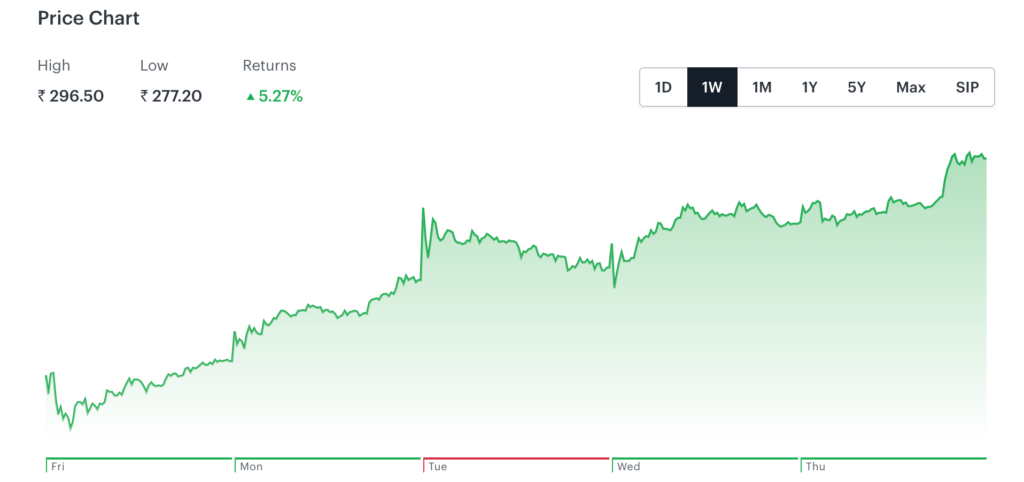
Vedanta’s stock is seeing a surge as the shares rise 0.41% as Sensex climbs. The stock quoted a 52-week low price of Rs 206.1 and a high of Rs 340.75.
TATA MOTORS
Sector: Consumer Discretionary
PE Ratio: 88.84
Largecap
1W Return vs NIFTY: 8.85
1W Return
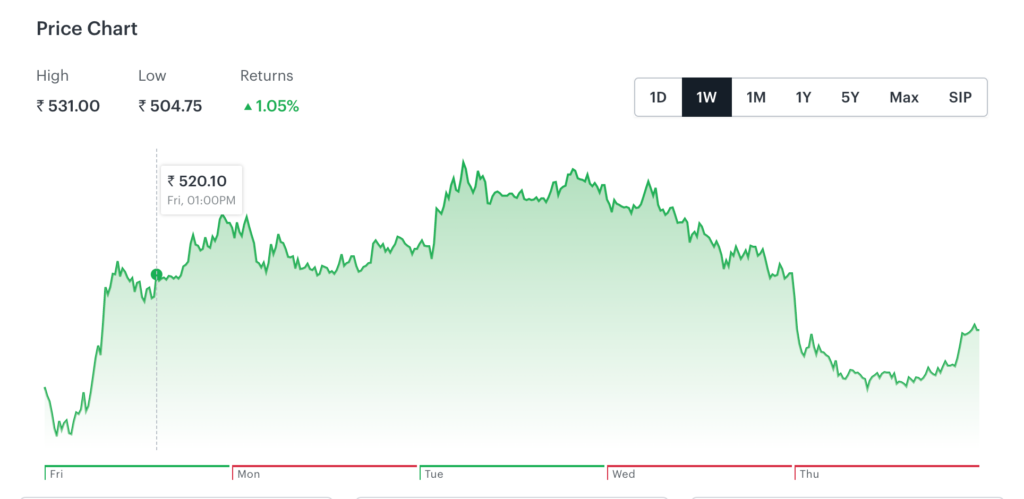
Tata Motors has captured the eyes as the automaker to increase the share of CNG on a green path to power vehicles as every 3rd vehicle will be either CNG or EV.
INFOSYS
Sector: IT Services and Consulting
PE Ratio: 22.40
Largecap
1W Return vs NIFTY: -21.88
1W Return
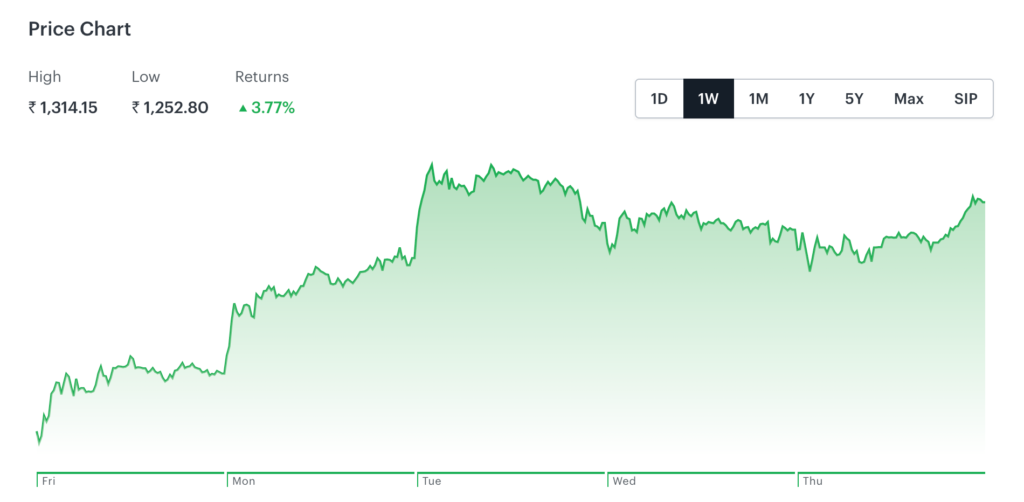
ICICI Direct recommends buying Infosys with a target price of Rs 1318, while the current market price stands at Rs 1319.85. The analyst suggests an intra-day time frame for reaching the defined target and advises setting a stop loss at Rs 1293.7.
GLAND PHARMA LTD.
Sector: Healthcare
PE Ratio: 19.49
Smallcap
1W Return vs NIFTY: -81.82
1W Return
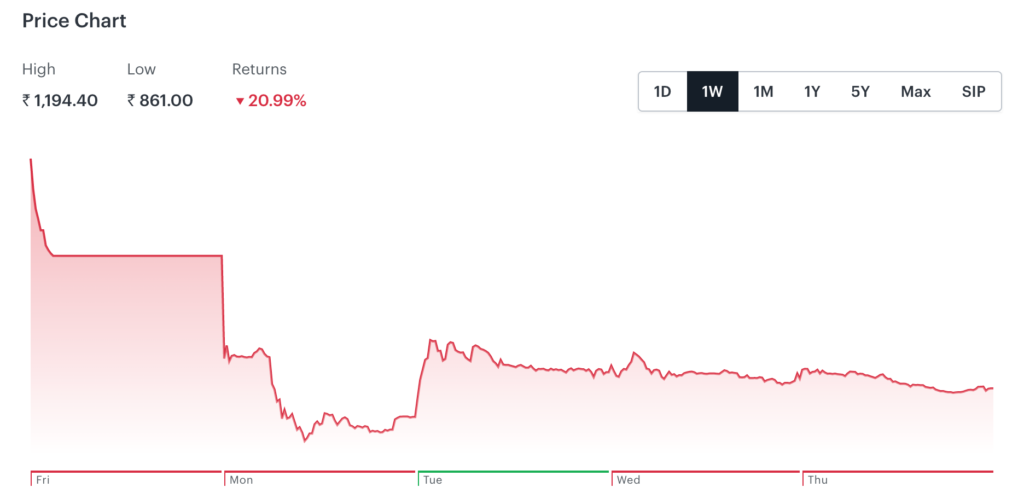
During the trading session, the Gland Pharma stock reached its 52-week high of Rs 558.85 per share. In another significant transaction, Morgan Stanley Investment Funds sold 9.60 lakh shares of Gland Pharma for Rs 89 crore. The specific fund involved in the sale was the Morgan Stanley Investment Funds Emerging Markets Equity Fund, which offloaded 9,60,271 shares at an average price of Rs 930.69 each. This resulted in a total deal value of Rs 89.37 crore. On Monday, Gland Pharma shares experienced a substantial decline, closing at Rs 893.85 per share on the NSE, representing a drop of 16.12%.
TRIDENT
Sector: Consumer Discretionary
PE Ratio: 37.09
Smallcap
1W Return vs NIFTY: -42.06
1W Return
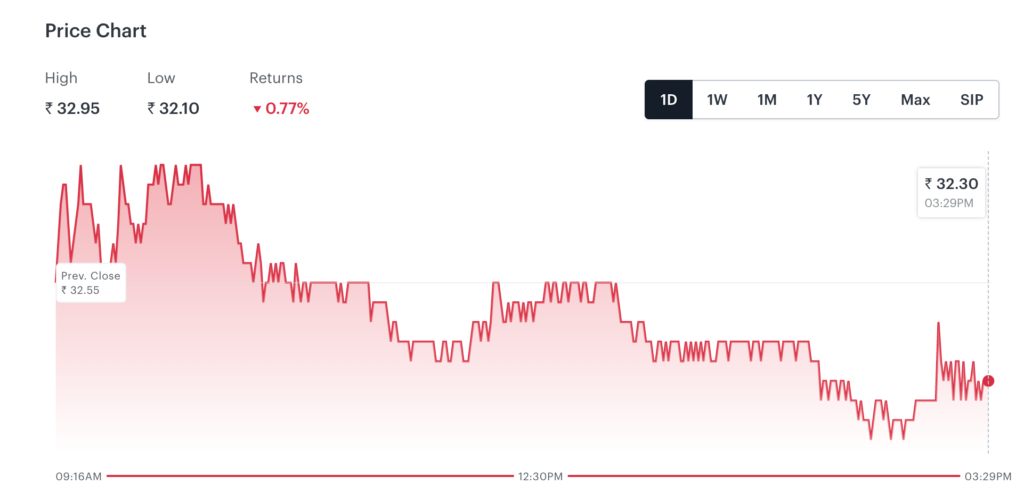
Trident has garnered attention due to its recent price fluctuations. After three consecutive days of gains, the stock has experienced a decline. Over the course of a year, the stock has fallen by 28.15% and has dropped by 4.23% this year alone. Notably, it reached a 52-week low of Rs 25.10 on March 27, 2023, and a 52-week high of Rs 49.35 on May 31, 2022.
TATA STEEL
Sector: Materials
PE Ratio: 14.63
Largecap
1W Return vs NIFTY: -13.26
1W Return
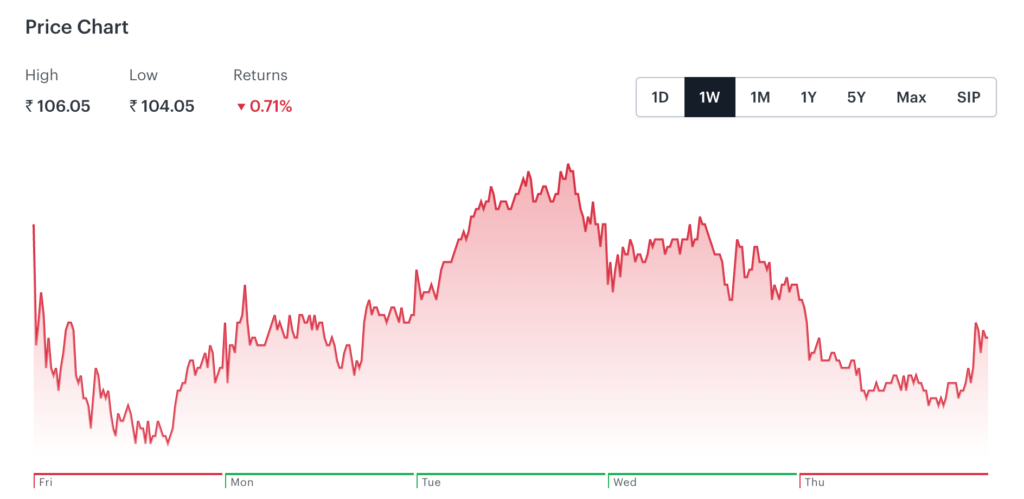
The stock market’s three-day gaining streak came to a halt, influenced by weak global trends. Several Sensex companies, including Tata Steel, experienced a significant decline and were among the major laggards during this period.
INDIAN RAILWAY FINANCE CORPORATION
Sector: Specialized Finance
PE Ratio: 6.60
Midcap
1W Return vs NIFTY: 35.71
1W Return
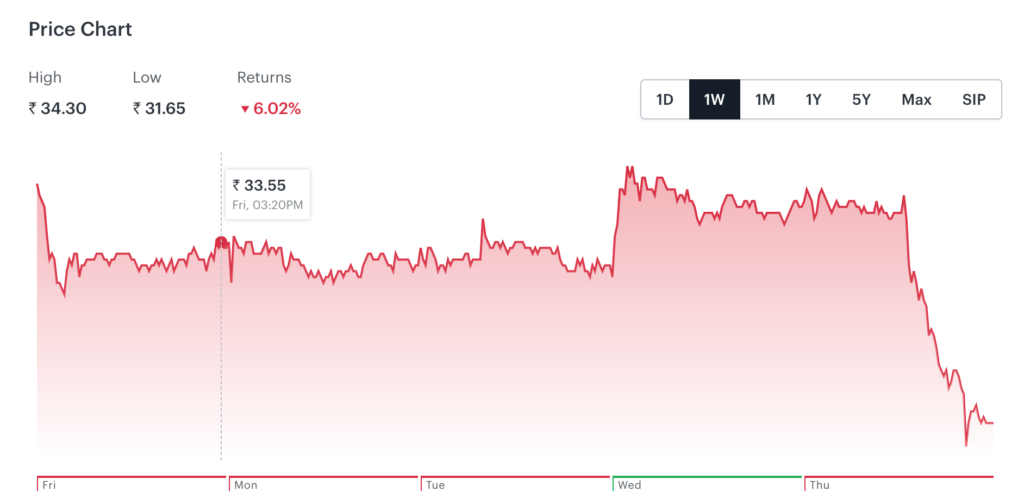
Indian Railway Finance Corporation (IRFC) shares continued their downward trend on Friday following the company’s disappointing financial results for the March quarter. The decline in IRFC shares is attributed to the company’s reported 11% year-on-year (YoY) decrease in net profit. For the March quarter, the net profit stood at Rs 1,327.70 crore, compared to Rs 1,492.50 crore in the corresponding quarter of the previous year.
ADANI WILMAR
Sector: Consumer Staples
PE Ratio: 106.13
Largecap
1W Return vs NIFTY: -49.88
1W Return
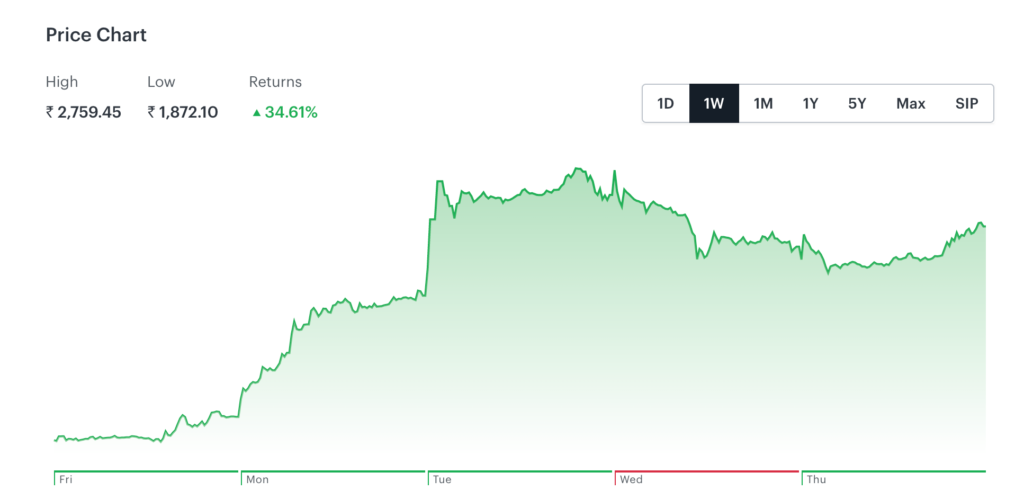
Among the listed peers of the Gautam Adani-led conglomerate, Adani Wilmar emerged as the top loser. The edible and FMCG products company experienced a decline of 4%, with its stock price dropping from Rs 464.40 to Rs 447.15 on Wednesday. As a result, its total market capitalization dipped below the Rs 60,000 mark.
Looking to stay updated on the stocks which interest you? Watchlist the stocks you want to keep an eye on, and analyse the fluctuations without any hassle.
- Akshaya Tritiya’25 on Tickertape – Terms and Conditions - Apr 9, 2025
- Gudi Padwa on Tickertape – Terms and Conditions - Mar 24, 2025
- Holi’25 on Tickertape – Terms and Conditions - Mar 4, 2025
