The PE ratio is a widely used metric to assess a stock’s current and future performance. It is ideal for investors to understand the PE ratio meaning and leverage it to gauge share prices.
Knowing what the PE ratio indicates will facilitate investment decisions and make it easier to start! Let us dive deeper to understand the meaning of the PE ratio, how to calculate the PE ratio, and what is a good PE ratio in India.
What is the PE ratio?

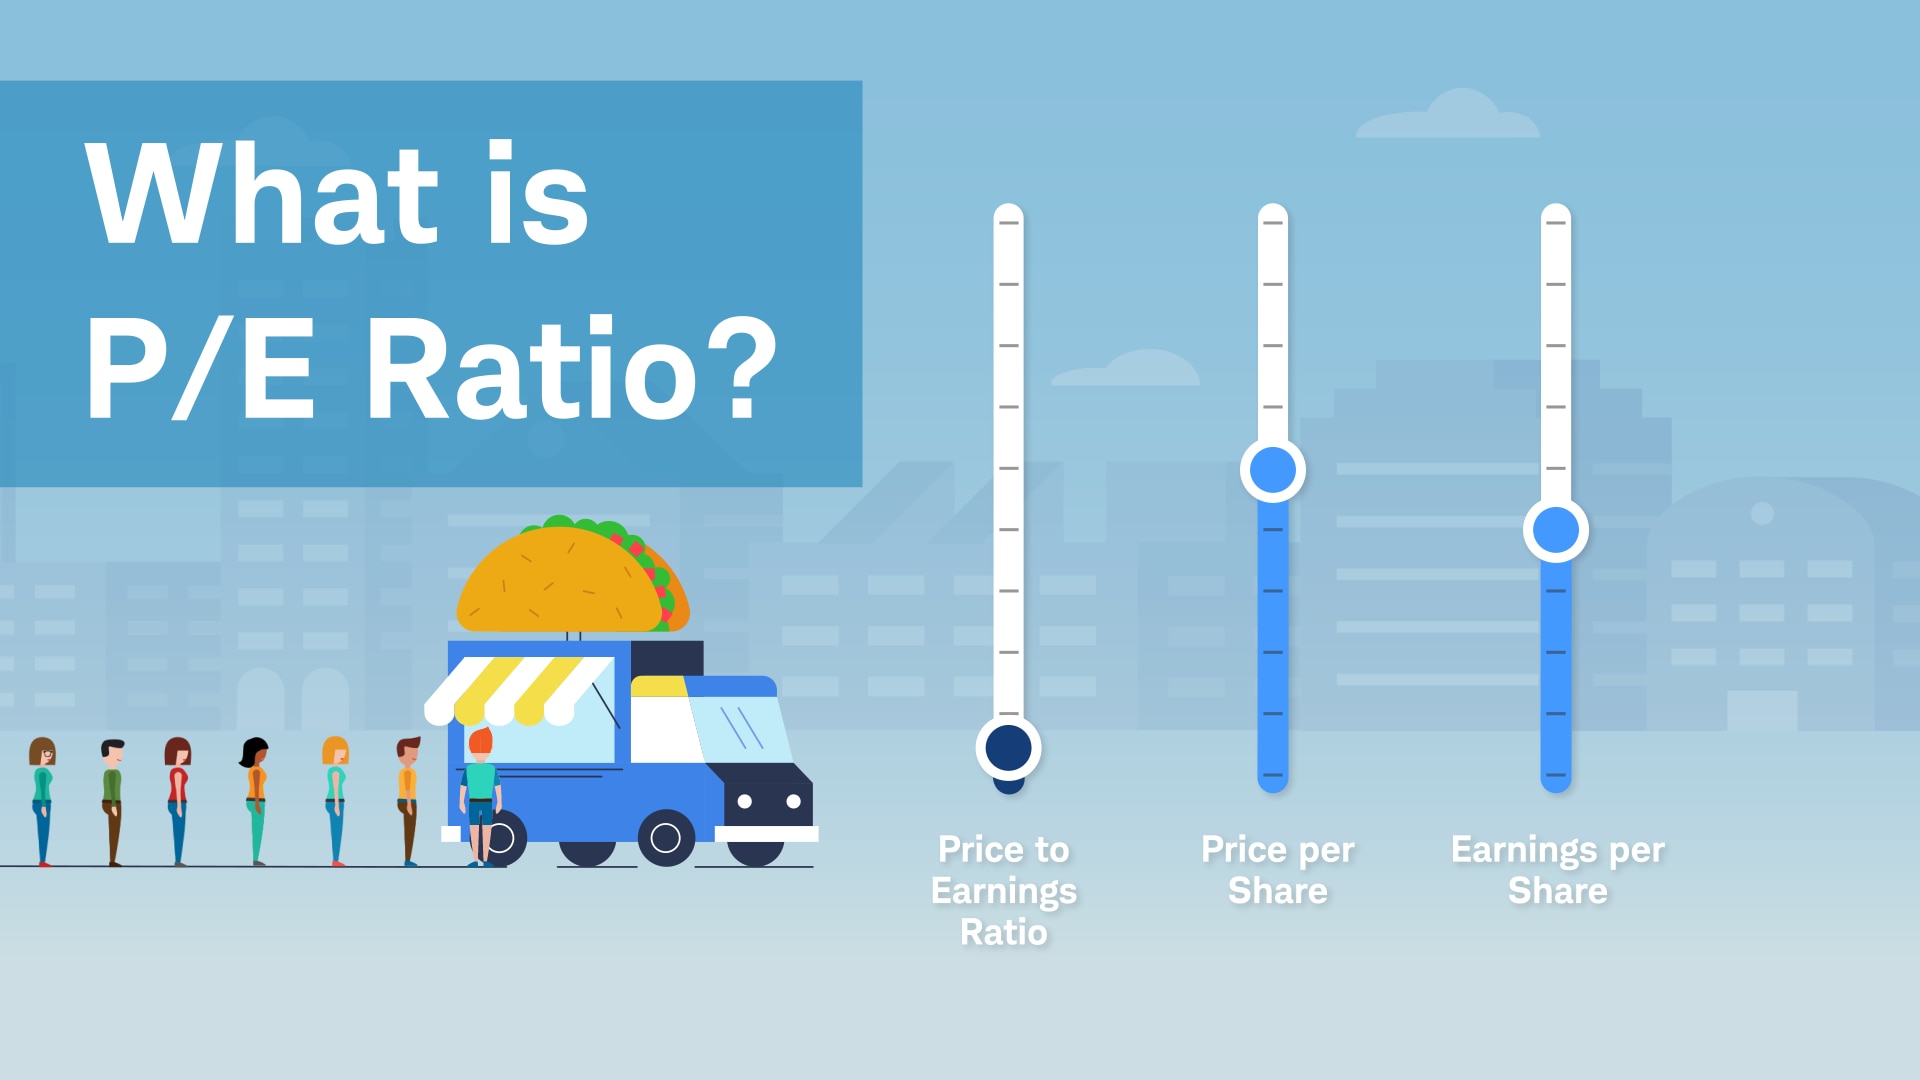
The full form of the PE ratio is the price-to-earnings ratio, which is derived by dividing a stock’s market price by its earnings. This ratio is arguably the most important financial metric used by investors to measure the earning potential of a stock.
Besides stocks, the PE ratio also helps analyse stock indexes. It is important to note that since the market fluctuates continuously, the price-to-earnings ratio for stock indexes and stocks is never steady. The ratio changes with moving market cycles or during quarterly or yearly result calls.
Return on equity: Highlights
- PE ratio signifies what the market (investors) are willing to pay for a stock based on the company’s past and future standing.
- PE ratio is a critical metric in the ratio analysis of a security.
- The PE ratio is the most extensively used metric by investors to value a stock and determine if it is overvalued, fairly valued, or undervalued.
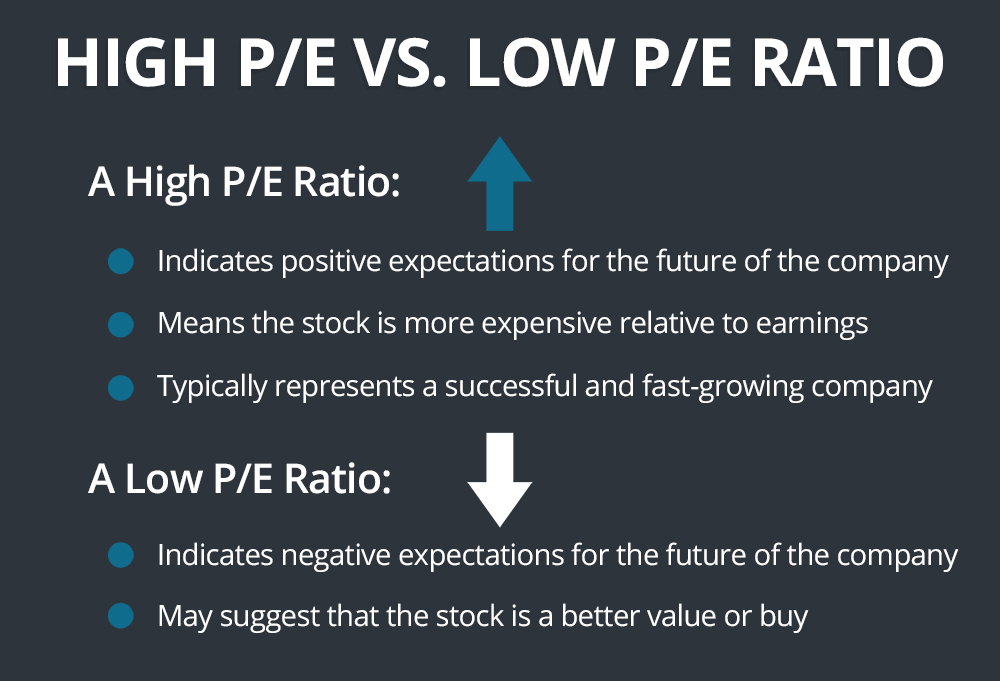
- A high PE ratio can indicate that the stock is overvalued, and a low PE ratio indicates the stock is undervalued.
How to calculate the PE ratio?
The PE ratio can be calculated by dividing a stock’s market price by its earnings per share. The outcome is then multiplied by 100. Here is the P/E ratio formula:
PE ratio = Price per share/Earnings per share (EPS)
PE ratio example

A stock’s price can be easily identified using a stock screener. For the most accurate stock prices and analysis, click here.
However, you may have to calculate EPS by diving deeper. The EPS can be derived by dividing the company’s total profit by the value of its outstanding shares. For example, assume Company B is worth 6 bn in INR and has 3 bn outstanding shares. This means it has Rs. 2 as EPS. Further, let us assume that the current stock price is Rs. 40 per share.
This gives a PE ratio of 20. Based on this ratio, you can check if Company B is overvalued or undervalued compared to others in the industry.
Different types of PE ratios
Mainly there are two types of PE ratios:
- Trailing PE ratio
In this type, the past 12 months’ earnings are considered to find a stock’s trailing P/E. This offers an accurate and unbiased view of the performance of a company.
- Forward ratio
Here, the potential earnings for the following 12 months are considered. The forward P/E ratio is useful to analyse how a company would perform in the near future and its potential growth rate.
Absolute and relative PE ratio
- Absolute PE ratio
The absolute PE ratio is obtained by dividing the current market price of a stock by the earnings per share of a company.
- Relative PE ratio
The relative PE ratio compares the present P/E with the past PE ratio of a company or the highest value in the range. So, if a company’s highest PE ratio was 30 in the last decade and the stock is trading at a ratio of 27, the relative P/E would be 0.9.
Understanding high PE and low PE ratio

A high P/E indicates that investors anticipate high future earnings and are ready to pay more for a stock. Stocks of companies with a low PE ratio are believed to be undervalued. But, it could also indicate poor existing and future performance.
However, the downside of high P/E is that growth stocks are volatile, which puts immense pressure on companies to justify a higher valuation which can prove risky.
What is a good PE ratio in India?
An ideal PE ratio depends on the company as well as the industry it belongs to.
A PE ratio of 30 may be good for one sector, while for some, a PE ratio of even 20 or 10 would be considered higher than the average.
How to use the PE ratio?
The PE ratio is used to gauge the price of a stock or index.
You can filter stocks based on their P/E performance. Furthermore, compare the PE ratio of the desired company with industry P/E and/or competitor P/E. Analysing some low P/E companies can find potentially undervalued stocks at good discounts.
Significance of PE ratio

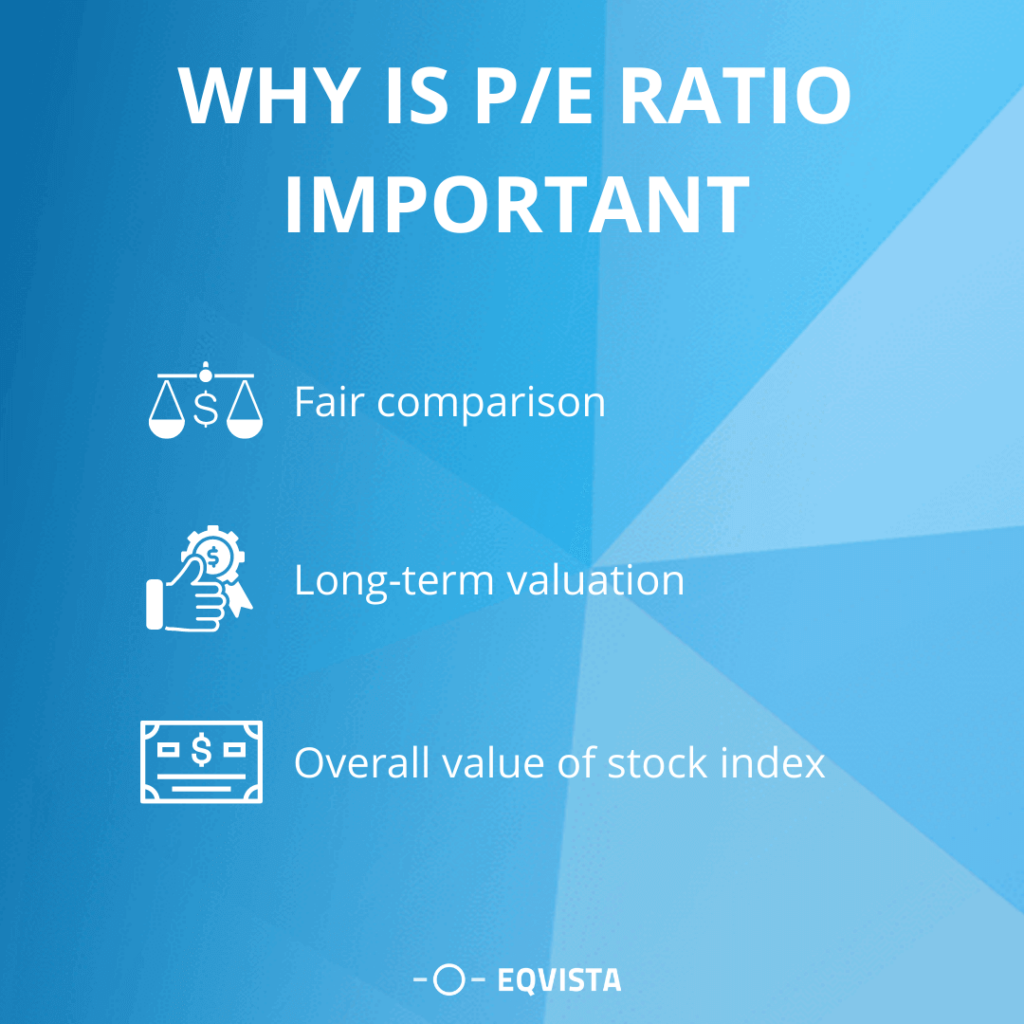
The PE ratio is the most used metric by analysts and investors to determine a stock’s relative valuation. It also helps to understand if a stock is overvalued or undervalued.
From an investor’s perspective, analysing the PE ratio is extremely important to know the actual worth of the investment. Furthermore, the ratio helps investors evaluate how much they need to pay for a stock based on its current earnings. Lastly, using the PE ratio, an investor can predict the future EPS and what a stock’s market value should be.
Relationship between PE ratio and value investing
Value investing refers to picking up stocks that may be trading lower than their intrinsic value. Investors may miss spotting such stocks because it may not be easy to filter, keeping in mind several metrics. But the PE ratio can help investors with value investing by aiding them in picking undervalued stocks.
Conclusion
The PE ratio, or the price-to-earnings ratio, is a valuation metric that helps you compare a company’s stock price and its earnings per unit. The ratio helps assess if the markets are overvalued or undervaluing a particular company’s stock. Generally speaking, if the PE ratio is low, it can mean that the stock is undervalued. On the other hand, a high PE ratio indicates that investors are hopeful about the company’s future earnings and are ready to pay more. It can signal that the stock is overvalued.


