Put call ratio charts are the go-to indicator for any F&O(Futures and Options) trader. This indicator helps gauge the market movement and devise strategies. Investors can study this metric to formulate option trading strategies.
But what is the Put Call Ratio (PCR), and how does it help analyse market trends? Let’s explore more about what PCR entails and its reliability as a market indicator.
- A put permits the trader to sell stocks at a predetermined price.
- A call permits the trader to purchase stocks at a prefixed cost.
- PCR is calculated by dividing the put volume by the call volume.
- Put call ratio analysis helps predict if the market sentiment is bearish or bullish in nature.
Understanding the put call ratio

Before you understand the put call ratio, you need to know the meaning of a ‘put’ and ‘call’ in the stock market.
What is a put?
A put option gives the holder the right to sell a specific quantity of the underlying asset at a pre-fixed price. The purpose of the put option is to protect investors against potential price declines in the underlying asset.
The payoff of a put option depends on the price of the underlying asset expiration, such as,
- If the market price is higher than the strike price (the price at which the security can be sold), the put option expires, with investors losing the premium paid.
- If the market price is lower than the strike price, the investor can sell the asset and make a profit.
The maximum risk for the holder of a put option is the premium paid to acquire it. There is no further obligation.
Example of a put option
Mr Harshit believes that a stock’s share price would fall down to Rs. 700. So, in the case of a put option, Mr Harshit decides on a strike price of Rs. 650. He purchases a put option contract for a premium of Rs. 20 per share, with a contract size of 100 shares. This gives him the right, but not the obligation, to sell the stock at Rs. 650, regardless of its market price.
If the stock’s price falls as Mr Harshit predicted, let’s say to Rs. 600, he can exercise his put option. He can buy the stock at the market price of Rs. 600 and then sell it at the higher strike price of Rs. 650 (as per the put option contract).
His profit would be:
Selling Price (Rs. 650) – Buying Price (Rs. 600) – Premium Paid (Rs. 20) = Rs. 30 per share.
Since the contract size is 100 shares, his total profit would be Rs. 3,000.
What is a call?
A call contract grants the right to purchase an asset at a predetermined price. The purpose of the call option is to speculate on the potential price increase of the underlying asset. Investors/traders can profit from the price difference between the strike price (the price at which the security can be bought by the option holder) and the actual market price.
Like a put option, the payoff of a call option depends on the price of the underlying asset expiration, such as,
- If the market price is lower than the strike price, the call option expires, and the investor loses the premium paid for the option.
- If the market price is higher than the strike price, the investor can buy the underlying asset at a lower market price and sell it at the higher strike price, making a profit.
The maximum risk for the holder of a call option is the premium paid to acquire it. There is no further obligation.
Example of a call option
Let’s continue with the above-mentioned example. Mr Harshit believed that the share price would go up from Rs. 700 to Rs. 900. He purchased a call option contract for a premium of Rs. 15 per share, with a contract size of 100 shares. This gives him the right, but not the obligation, to buy the stock at Rs. 750, regardless of its market price.
If the stock’s price rises as Mr Harshit predicted, let’s say to Rs. 900, he can exercise his call option. He can buy the stock at the market price of Rs. 900 and then sell it at the higher strike price of Rs. 750 (as per the call option contract).
His profit would be:
Selling Price (Rs. 900) – Buying Price (Rs. 750) – Premium Paid (Rs. 15) = Rs. 135 per share
Since the contract size is 100 shares, his total profit would be Rs. 13,500.
What is the Put Call Ratio (PCR)?
To go by its literal meaning, PCR is the ratio of the puts to the calls. Put call ratio indicator is a derivative metric used to predict the direction in which the market would move.
When traders purchase more calls than puts, PCR signals a bullish sentiment. The opposite, that is, when the puts are relatively higher than the calls, the PCR is high, indicating that the market has a bearish sentiment.
Put Call Ratio (PCR) calculation
There are two ways to find out the put call ratio. Let’s look at both of them.
Based on the volume of options trading
This put call ratio formula is quite simple. You can find it below.
Put call ratio = Volume of puts / Volume of calls
The volume indicates the total put/call options initiated over a specific time frame.
Based on open interests of a specific day
The open interest is the sum of outstanding contracts at the end of the day. Let’s see how to use it to find the value of the put call ratio below –
PCR formula based on Open Interest (OI) = Total put open interest / Total call open interest
The data of all these variables are readily available on the Nifty website.
To depict the final value, refer to the below-mentioned points.
- When the put call ratio is less than 1, the investors buy more call options than the put options. This indicates a bullish trend.
- When the PCR ratio is greater than 1, investors purchase more put options than call options. Hence, it is an indication of a bearish trend.
- The final case indicates a neutral trend. In this scenario, the investors purchase the same number of put options and call options. The PCR value here becomes 1.
Example of put call ratio
Suppose in a given market scenario, there are below-mentioned put and call outstanding options.
| Type of option | Outstanding contracts |
| Put | 5,000 |
| Call | 7,000 |
The formula for PCR based on outstanding contracts is –
PCR = Total put open interest / Total call open interest
Hence,
PCR = 5000/7000
PCR = 0.714
The PCR is less than 1, which indicates that investors are buying more call options when compared to put options. This indicates a bullish trend.
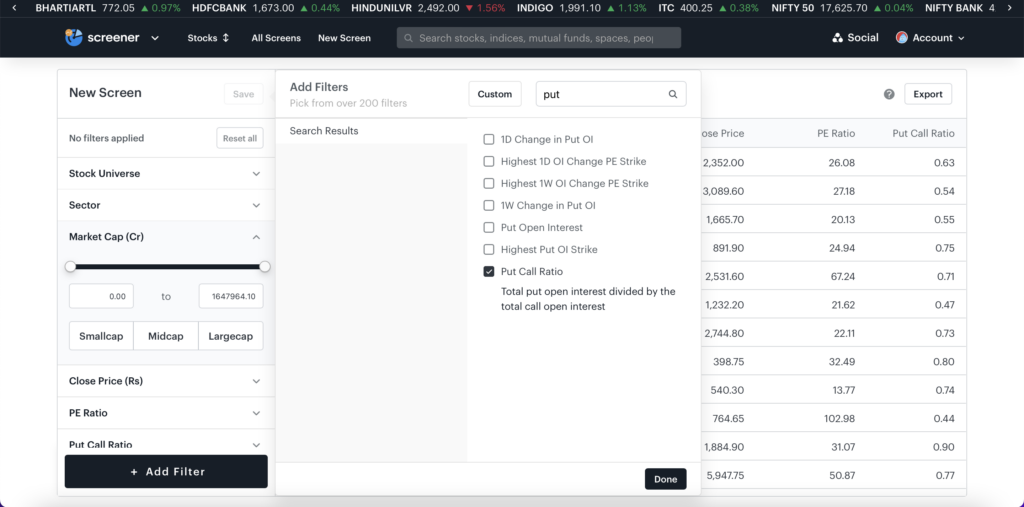
Now that you know how to calculate the put call ratio, use Tickertape Stock Screener to find the PCR of stock easily. Use the Stock Screener and find the best stocks based on 200+ filters.

How to analyse the put call ratio?
With the knowledge of put call ratio meaning and put call ratio calculation, let’s discuss the right way to analyse the PCR! Before we begin, there are two things to remember:
- The traders are not obligated to sell or buy the assets on a preset date.
- Contrarians in the stock exchange are typically the people who reject a popular opinion.
To analyse a put call ratio, traders must critically assess the denominator and numerator part of the formula apart from the ratio. The put-call ratio can be significantly altered by changing either of them. The below table illustrates the put call ratio analysis.
| Put call ratio | Analysis |
| Decrease in put call ratio when the market is trending down. | This indicates a bearish trend. This means that the option writers are aggressively selling their calls. |
| Decrease in put call ratio when the market is testing the resistance levels. | This is also a bearish indication. In this case, call writers are accumulating fresh stocks in hopes of a market correction or an upsurge in prices. |
| Increase in put call ratio when the market is trending upwards. | This is a bullish indication. It reveals that the traders are now more inclined towards the writing puts as they are optimistic about the continuation of the uptrend. |
To better gauge the market, traders often combine the put call ratio with implied volatility (IV) to identify whether long (bullish) or short positions (bearish) have been generated in the market.
Now, implied volatility is a market metric that forecasts a likely movement in the price of a security. It also helps traders and investors estimate future fluctuations in price.
Nifty option chain: Put call ratio
Nifty put call ratio is a handy indicator for traders dealing in day trading or intraday trading. These are some of the indicators that traders can look into to gain more insights into the market dynamics. The below table represents the Nifty put call ratio interpretation in four different scenarios.
| Nifty PCR | Interpretation |
| Steadily rising PCR during the day along with Nifty Spot. | Bullish |
| PCR decline during a down-trending market correction. | Bearish |
| Declining PCR when Nifty Spot is near the resistance level. | Bearish |
| PCR rose during the correction in the uptrend market. | Bullish |
Why is PCR important?
Put call ratio is a contrarian factor that can help determine the market extremities. When the traders are bearish, contrarians are on the bullish side. The reverse also holds true. This means that the same ratio is interpreted differently by both parties involved in the stock exchange.
Typically, a 0.7 PCR is used as a compass in the market. This means that the market is bullish when the value drops below 0.7 and approaches a value of 0.5. In addition, when the value exceeds 0.7, the market is assumed to be bearish. In this sense, by analysing the PCR, investors can take positions in the markets and even formulate entry and exit points.
Conclusion
Traders use various methods to gauge market trends, and the put call ratio is one of them. Depending on the ratio, you can gauge the market’s direction. Understand how derivatives and the PCR function to better understand the market’s sentiment and take your futures and options decisions!


