Last Updated on Dec 20, 2022 by Aradhana Gotur
Investing in mutual funds is an excellent way of diversifying risk and optimising returns. Like other asset classes, picking a mutual fund that fits your portfolio requires smart analysis. Tickertape’s Mutual Fund Pages help you do just that. These pages host important information related to the scheme, performance, fund manager, key metrics, and more to help you analyse mutual funds well before making an investment decision. They also make mutual fund comparison easy.
Let’s explore Tickertape’s Mutual Fund Pages and learn how each feature helps you make well-informed decisions.
Table of Contents
Launching a Mutual Fund Page on Tickertape
You can analyse any scheme on Tickertape simply by launching the respective Mutual Fund Page. Simply find your desired Mutual Fund in the search box.
How to analyse mutual funds on Tickertape
Tickertape’s Mutual Funds Pages are information-rich, filled with details essential to make smart, data-backed investment decisions.
Let’s look at how these help you analyse a mutual fund of your choice in minutes.
1. Investment checklist helps you quickly gauge the feasibility of schemes
You can find this investment checklist on the left-hand side of the page. As a first step, you can see if the four essential metrics here are ticked off when analysing a mutual fund scheme.

The metrics are:
- Returns – Learn whether the fund has been able to generate better returns compared to peers.
- Expense ratio – Fee paid by investors to the mutual fund house. This shows the fund’s expense ratio compared to peers. Less expense ratio means better returns in the long run.
- Return vs FD rates – Fund’s returns compared to the average fixed deposit rates offered by banks. The higher the fund’s return, the better it is.
- Red flags – Considers red flags of the fund’s holdings like ratings for debt securities, pledged promoter shares, default probability, presence of stocks in negative lists, etc.
2. Get an overview of the mutual fund scheme, AMC, performance, fund manager details and tax incidence
In the overview tab, you can find vital information about the AMC profile, scheme details, and key metrics. For one, you can see a price chart that shows the fund’s performance over various timelines, including 1 month, 6 months, 1 yr, and so on.
Next, you can learn about the underlying asset class of the fund, Assets Under Management (AUM), and risk associated with it. You can also find key metrics such as expense ratio, alpha and beta values, tracking error, Sharpe ratio, and yield to maturity of the fund. Additionally, you will know the minimum lump sum investment and SIP amount allowed in the scheme.

Note:
- While the beta is a measure of the fund’s volatility compared to the market, alpha shows the fund’s excess return compared to its benchmark. Remember, the higher the alpha, the more the risk. That’s the risk-reward principle. So ensure to move in line with your risk tolerance.
- The expense ratio is the cost of operating and running the fund and is measured as a percentage of the fund’s assets. The lower the ratio, the more returns you can enjoy. However, do not look at this metric in isolation, as it can lead you to make ill-informed decisions.
- Sharpe ratio is the average return earned over and above the risk-free rate per unit of total risk or volatility.
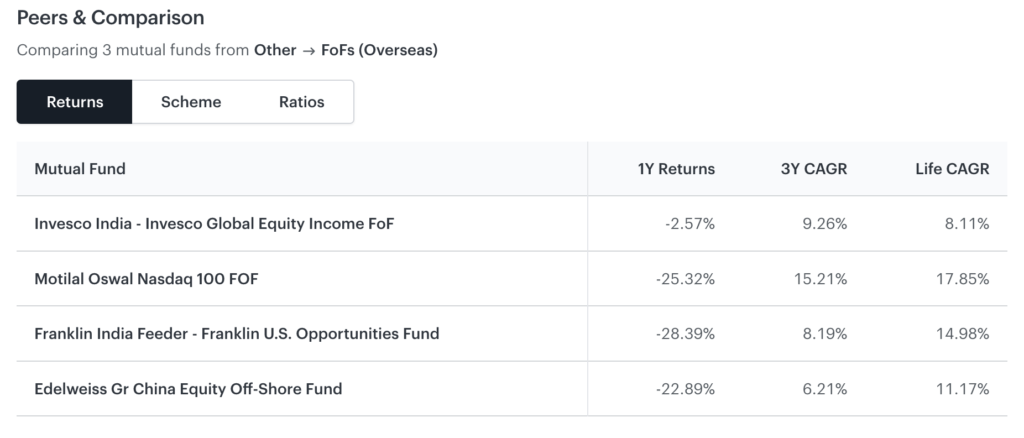
In addition, you can also compare mutual fund performance with peers based on key metrics: 1Y returns, 3Y CAGR, and expense ratio. This allows a quick comparison, but if you want to do a deeper analysis, you can click on any peer scheme to open the respective Mutual Fund Page and get started.
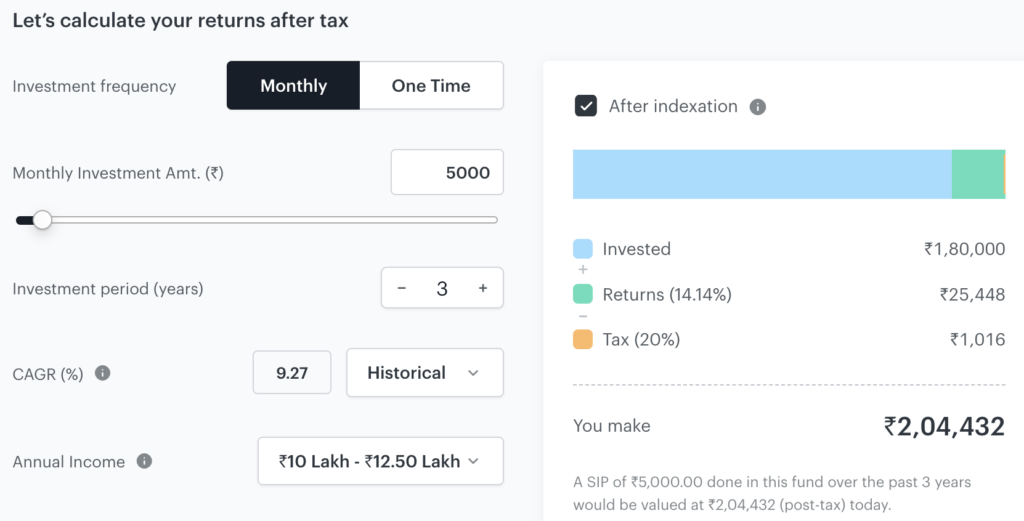
Ascertain your likely tax incidence using the tax calculator
What really highlights Tickertape’s Mutual Fund Pages is its “Tax Calculator”. Here, you can learn the tax implications of investing in units of a mutual fund for less than and over 1 yr. The calculator also ascertains your post-tax returns based on the data you enter. All you have to do is select your investment frequency, set your monthly contribution, expected CAGR of the fund, investment horizon, and your estimated annual income.
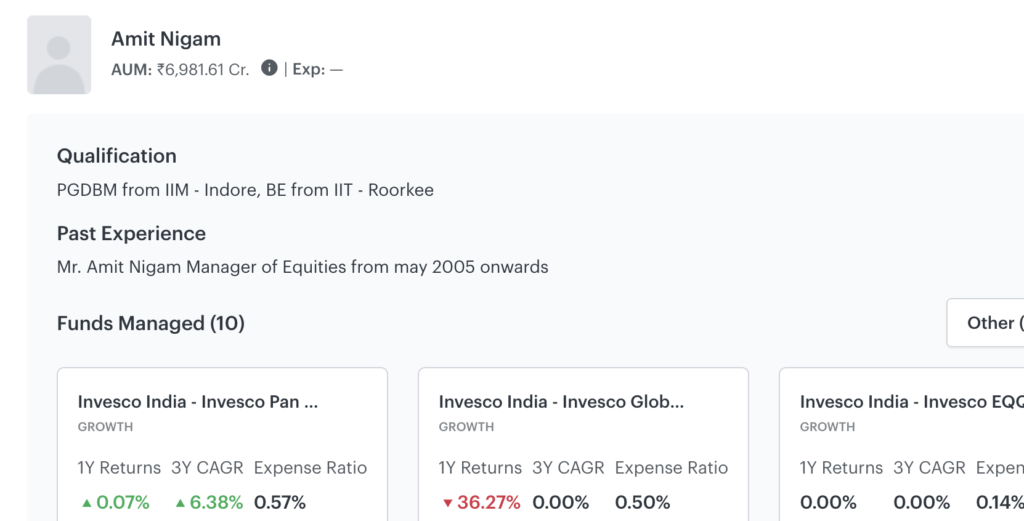
At the end of the Overview tab, you can take a quick look at the basic information of the fund manager like their name, years of experience in the financial markets, and the total number of funds they have managed so far.
3. Compare mutual fund performance in the Peers tab
This tab of Tickertape’s Mutual Funds Page allows you to make a detailed comparison of three peers based on returns, scheme, and ratios. In addition, you can also make a price comparison of three funds for your desired timeline.
4. Analyse the holdings of the mutual fund
The Portfolio tab throws light upon quarterly targeted and actual Asset Allocation of the fund, quarterly sector distribution, and sector weightage over various timelines. The “Current Holdings” lists the constituents of the mutual fund, holding weightage, and 3M change. This will give you insights into where your money is going. You can make conclusions such as the sector to which you are most and least exposed.
5. Know the fund manager, their expertise, and performance
Since mutual funds are managed by experts called fund managers, the performance of the scheme depends on their experience and expertise to a large extent. Therefore, we made such information about the fund managers managing the scheme available in this tab.
You can see details like the total AUM managed by the fund manager across all funds, their educational qualifications, their past experience, and the details of the other funds they have managed.
Other funds managed by the fund managers are grouped based on categories like equity, debt, hybrid, and others, and so on, to help you gauge their expertise accordingly.
On scrolling further down, you can find the Manager Performance section, where you can view the manager’s performance compared to their peers managing similar funds based on the Avg 1-yr return metric.
Note that this is a Pro-only feature. Subscribe to a Tickertape Pro plan suitable to you to use this feature.
6. Go through the opinions and fund reviews by experts and the market
This tab is a one-stop shop for curated video content about a specific Mutual Fund from financial advisors, YouTube content creators, the AMC, fund managers, etc. This feature is free to access by both Tickertape Basic and Pro users.
There you have it! Tickertape’s Mutual Funds Pages offer you all the information you need to evaluate your desired scheme without having to jump on various platforms. Go ahead and try them yourself.
Frequently asked questions
How to analyse mutual funds?
One of the easiest ways to analyse mutual funds is using Tickertape’s Mutual Funds Pages. Rich with information on the scheme, fund manager, key metrics, expense ratio, tax incidence and more, mutual fund pages help you deep dive into the mutual fund scheme and make meaningful investment decisions backed with data. You can also make peer comparison to know where the fund stands compared to others in the same category.
What does mutual fund analysis mean?
It means analysing a scheme for the feasibility of investment before making any decision. Mutual fund analysis involves reviewing the fund’s past performance, studying the fund’s return and risk elements, doing a peer comparison, etc.
What is mutual fund CAGR?
CAGR in mutual funds stands for the compounded annual growth rate or annualised returns over a timeline. Most commonly, investors look for 5 yr, 7 yr and 10 yr CAGR.
How to compare mutual funds?
Comparing mutual funds is relatively easy on Tickertape. Simply launch your desired mutual fund page and head to the Peers tab. There you can compare a scheme with its peers based on parameters like expense ratio, returns, yield to maturity, Sharpe ratio, Standard Deviation, and so on. This helps you know where your mutual funds stand compared to others in the same category.
Which is the best mutual fund to invest in now?
While this is subject to the fund’s performance, your investment objective and expectations, Mutual Fund Screener can help discover top schemes. Built with over 45 filters like Sharpe ratio expense ratio, volatility, rolling and CAGR returns, the Mutual Fund is intuitive and helps you find the top schemes based on metrics that matter to you. From there, you can venture into the respective Mutual Fund Page to dive deep into each scheme and shortlist the ones that fit your portfolio.
- Best Performing Index Funds in India (2025) - Jun 5, 2025
- Issue of Shares – Meaning, Types, Examples and Steps - Jun 4, 2025
- Banking Mergers in India – List of Merged PSU Banks, Advantages, and Challenges - Jun 3, 2025




Where can I find mutual fund scanner?
i am not able find portfolio section tickertape app