A portfolio is a collection of financial instruments
Your portfolio is a selection of financial instruments in which you have invested your money. By financial instruments we mean various investment options like Shares, Mutual Funds, Real Estate, Banks Fixed Deposits and Bonds.
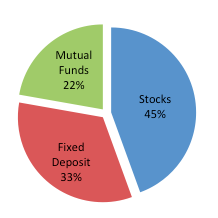
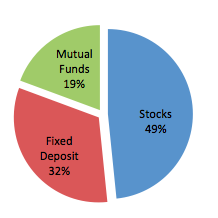
Let’s taken an example to understand this. Suppose, five years back Mr Trump made 3 different investments. He put INR 20,000 in stocks, INR 15,000 in mutual funds and INR 10,000 in Bank FD. The total initial portfolio value of Mr Trump was INR 45,000, as represented in the first pie chart below. This total portfolio value is called networth. Today, the same investments have grown and the value of the stocks that Mr Trump bought is INR 30,000, value of the mutual funds is INR 20,000 and amount in Bank FD is INR 12,000. So the current total portfolio networth of Mr Trump is INR 62,000, as shown in the second pie chart.

Initial Networth: INR 45,000

Current Networth: INR 62,000
As you can see in the above pie charts, weight of stocks in Mr Trump’s portfolio increased from 45% to 49%. Weight of any instrument is current value of the instrument divided by the portfolio networth. It shows the portion of total networth represented by a particular instrument. Initially the value of the stocks was INR 20,000, so the initial weight was 22% (20,000/45,000). After five years, the value of the stocks is INR 30,000 and total networth is INR 62,000. Thus, the current weight is 49% (30,000/62,000).
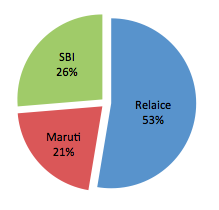
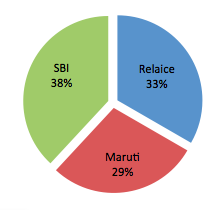
Instead of investing in different types of financial instruments, one can invest in different financial instruments of the same type. For example, you can buy 3 different stocks. In this example, the instrument type is Equities (shares) for all the investments. Let’s take the same example again. This time instead of three different types of instruments, Mr Trump bought 3 different stocks – Reliance, Maruti and SBI. He put INR 50,000 in Reliance, INR 20,000 in Maruti and INR 25,000 in SBI. After 5 years, current value of these investments in Reliance, Maruti and SBI are INR 35,000, INR 30,000 and INR 40,000. These pie charts show what happened with Mr Trump’s portfolio in last 5 yrs.

Initial Networth: INR 95,000

Current Networth: INR 1,05,000
By looking at above charts, we can easily conclude that Reliance generated less returns compared to Maruti and SBI, in last 5 years.


Add a comment